Profiles by theme
Choosing a theme from either the home page or the Data menu item creates a report containing data for the UTLA/LA level. It is then possible to select other geography levels to see data for a given ward or LSOA division.
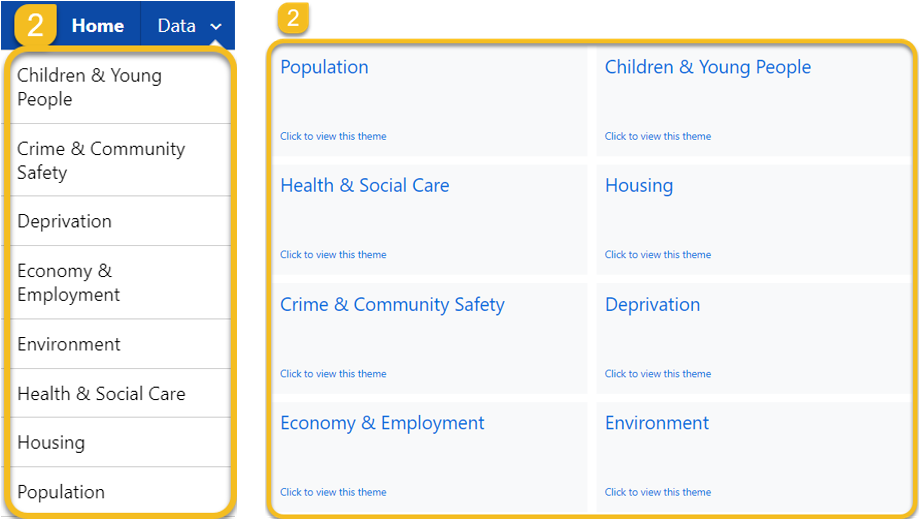
Step 1 - Begin at the Home page or use the Data menu
![]()
Step 2 - Choose a theme
Next, view the report for a chosen geography and area.
Step 3 - Choose the report view

Step 4 - Choose a geography level and area

Next, view an indicator in Map view.
Step 5 - Choose the map view

The map facility allows for a single indicator to be shown on a thematic map. Options for creating the map include:
- A searchable set of indicators within the selected theme
- Geography level selection
- Animated time series feature (where available)
- A selection of boundary layers and base maps
- A selection of thematic, aka choropleth, map classifications and a proportional circles option
- The chart legend for the selected classification
- A table of feature values, e.g. ward values
- Printing/PDF output options